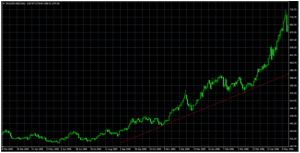
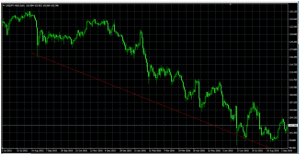
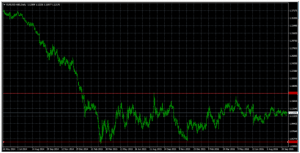
How to view charts?
Forex traders have developed multiple ways to analyze the trends of currency pairs. Fundamental traders may look for references in news sources such as Dailyfx.com.hk, to see how exchange rate, economic growth, employment, inflation and political risk influence the supply and demand of currencies. Technical traders, however, use chart tools and indexes to recognize the trends and the important prices of entry & exit.
But, you all have to learn how to interpret charts no matter which group of traders you are.
▪Build up the price chart
In the beginning, click the “New Icon” button on the top. Then, choose your currency pair, period and appoint data range.
Period means the cycle of chart update. For example, we set up the period as D1, which means that every point in the chart represents the data in a trading day. If we set up the period as m5, then every point in the chart represents data in every 5 minutes. Data range means the number of data you wish to place in the chart. You have to set up the data range as one year if you wish to view the data all year round.
▪The use of candle stick chart

The chart type by default is called “Candle Sticks”. Such charts are frequently used in forex market. The sticks indicate the opening and closing prices, top and bottom prices within the chosen period. The candles indicate the opening and closing prices, while sticks indicate top and bottom prices.
In case that the closing price is higher than the opening price the previous candle, the candle will be in blue. On the contrary, the candle will be in red if the closing price is lower than the opening price of the previous candle. Candles allow traders to find out whether the closing price is rising or dropping during transactions easily.
▪The addition of indexes
It might help you to make decisions on transactions by simply viewing the forex charts, but quite a few traders use technical indexes to help them to make more well-founded decisions. These tools help traders to recognize price trends to predict price fluctuations in the future. The transaction platform comes with more than thirty hot preloaded indexes, and nearly six hundred hot and customizable indexes can be downloaded online. Click the chart and choose “Add New Indexes” if you want to add indexes into the chart.
▪The drawing of trend lines


Your capital is at risk. You may lose more than you invest. Risk Policy.